'via Blog this'
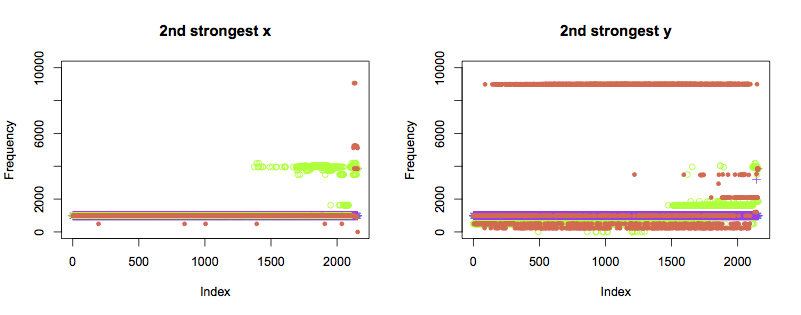
Above are graphs for the strongest component for each bearing over time. In both the x and y axes for all bearings, the strongest FFT component is the dc term for the majority of the experiment. The single exception is the final measurement from bearing 3 in the x axis, for which the strongest component is at 1Hz. This is not very informative overall, as it would be better to see a trend towards failure rather than the failure itself.
No comments:
Post a Comment